Despite the lazy containers of SwiftUI and the memory optimization mechanisms of Core Data, as the complexity of application views increases (such as mixed text and images), more and more developers are encountering situations where memory usage is so high that it causes the app to crash. This article will go through a step-by-step memory optimization process for a demo app (originally using 1.6 GB of memory to display 100 data items, optimized to display hundreds of data items using only 200 MB memory). This will provide readers with a better understanding of the persistence period of SwiftUI views, the lifecycle of subviews in lazy views, the lazy properties of managed objects, and the row cache of the persistence store coordinator.
The code required for this article can be downloaded from here.
An App with Huge Memory Usage
In this section, we will create a demonstration app that allows browsing of Core Data data in a List.
In this example, the Core Data data model is very simple, consisting of only two entities: Item and Picture. There is a one-to-one relationship between Item and Picture. To minimize the impact on the performance of SQLite database operations, we have enabled the ‘Allows External Storage’ option for the data property of Picture.


After enabling Allows External Storage, SQLite will automatically save Binary data with a size larger than a certain requirement (100KB) as files in a hidden subdirectory at the same level as the database file. Only the file ID corresponding to the file is saved in the database field (50 bytes). Typically, developers enable this option for larger Binary attributes to ensure database performance.
The list view is quite simple:
struct ContentView: View {
    @Environment(\.managedObjectContext) private var viewContext
    @FetchRequest(
        sortDescriptors: [NSSortDescriptor(keyPath: \Item.timestamp, ascending: true)],
        animation: .default)
    private var items: FetchedResults<Item>

    var body: some View {
        NavigationView {
            VStack {
                List {
                    ForEach(items) { item in
                        ItemCell(item: item)
                    }
                }
            }
        }
    }
}
Cell view also adopts a common format:
struct ItemCell: View {
    @ObservedObject var item: Item
    let imageSize: CGSize = .init(width: 120, height: 160)
    var body: some View {
        HStack {
            Text(self.item.timestamp?.timeIntervalSince1970 ?? 0, format: .number)
            if let data = item.picture?.data, let uiImage = UIImage(data: data), let image = Image(uiImage: uiImage) {
                image
                    .resizable()
                    .aspectRatio(contentMode: .fit)
                    .frame(width: self.imageSize.width, height: self.imageSize.height)
            }
        }
        .frame(minWidth: .zero, maxWidth: .infinity)
    }
}
After generating data, the displayed status upon running is as follows:

Clicking on the “Add 100” button will create 100 records. The number of records will be the current number of data entries, and the memory usage will be the current memory usage of the app. The specific implementation can be viewed in the demonstration code of this article.
After creating 100 data entries, restart the app (restarting can more accurately measure the memory usage). Scroll the list to the bottom. At this point, the memory usage of the app is about 1.6GB. Don’t be surprised. You can try clicking on the “Add data” button to continue adding data, scroll to the bottom again, and you will see even more shocking memory usage numbers, but there is a high possibility that you will not be able to see them (the app has already crashed).。

According to the analysis from Instruments, memory usage continues to increase as the list is scrolled.

I believe that no developer can tolerate this kind of memory usage. In the following text, we will gradually optimize this code to achieve the final usable level.
First Optimization Round: Optimize the View Body Value
In the first round of optimization, we will first try to start from the perspective of SwiftUI.
The lazy view container of SwiftUI has the ability to optimize the content that conforms to the DynamicViewContent protocol (generated by ForEach). Under normal circumstances (the lazy container only contains one ForEach and the subviews do not use id to add explicit identification), the lazy container only creates subview instances within the currently visible range and evaluates their body (rendering).
When a subview enters the visible area of the lazy container, SwiftUI calls its onAppear closure, and when the subview exits the visible area, it calls the onDisappear closure. Developers usually use these two calling opportunities to implement data preparation and post-processing.
Although on the surface, the lazy container only operates on the view when it enters the visible area, once the view has been displayed (body has been evaluated), SwiftUI will still save the body value of the view even if the view leaves the visible area. This means that in the lazy container, once the view is created, its survival period will be consistent with the container (if the container is not destroyed, the view will always exist).
In this case, the body value of the subview will definitely contain image data for display. Therefore, even if the subview has been displayed (scrolled out of the visible area), the body value of the subview will still occupy a considerable amount of memory.
We can control the display of the image (variable show) in onAppear and onDisappear (forcing SwiftUI to re-evaluate the body of the view), thereby reducing the memory usage caused by the above reasons.
Make the following adjustments to the Cell view code (ItemCell.swift):
struct ItemCell: View {
    @ObservedObject var item: Item
    @Environment(\.managedObjectContext) var viewContext
    let imageSize: CGSize = .init(width: 120, height: 160)
    @State var show = true
    var body: some View {
        HStack {
            if show { // Show content only when in the visible area of the lazy container
                Text(self.item.timestamp?.timeIntervalSince1970 ?? 0, format: .number)
                if let data = item.picture?.data, let uiImage = UIImage(data: data), let image = Image(uiImage: uiImage) {
                    image
                        .resizable()
                        .aspectRatio(contentMode: .fit)
                        .frame(width: self.imageSize.width, height: self.imageSize.height)
                }
            }
        }
        .frame(minWidth: .zero, maxWidth: .infinity)
        .onAppear {
            show = true // Show when entering the visible area
        }
        .onDisappear {
            show = false // Do not show when leaving the visible area
        }
    }
}
With these simple changes, the current app’s memory usage has significantly improved. After scrolling to the bottom (100 data items), memory usage will be around 500MB.

Using Instruments may cause inaccurate results in optimized display, and memory usage data will be based on the display in the App and the content of the Debug bar in Xcode Navigator. If scrolling too fast, it may cause an increase in memory usage. It is estimated to be related to the system’s inability to perform cleaning operations.

Although the above optimization techniques may have some impact on the smoothness of scrolling (visually imperceptible), considering the huge benefits it brings, it should be a very good choice in this case.
Like the unoptimized code, as the amount of data increases, memory usage will also increase. When scrolling to the bottom with 400 records, the memory usage is about 1.75 GB. Although we have saved almost 70% of memory usage, we still cannot fully meet the requirements.
Second optimization: Let managed objects return to lazy state
In the second optimization, we will try to find a solution from Core Data.
First, we need to understand the lazy property of managed objects and the “row cache” concept in the coordinator.
Row cache in coordinator
In the multi-layer structure of the Core Data stack, the storage coordinator (NSPersistentStoreCoordinator) is located between the persistent storage and the managed context. It provides a single unified interface to the managed context and persistent storage, and one coordinator can handle multiple contexts and multiple persistent storages.
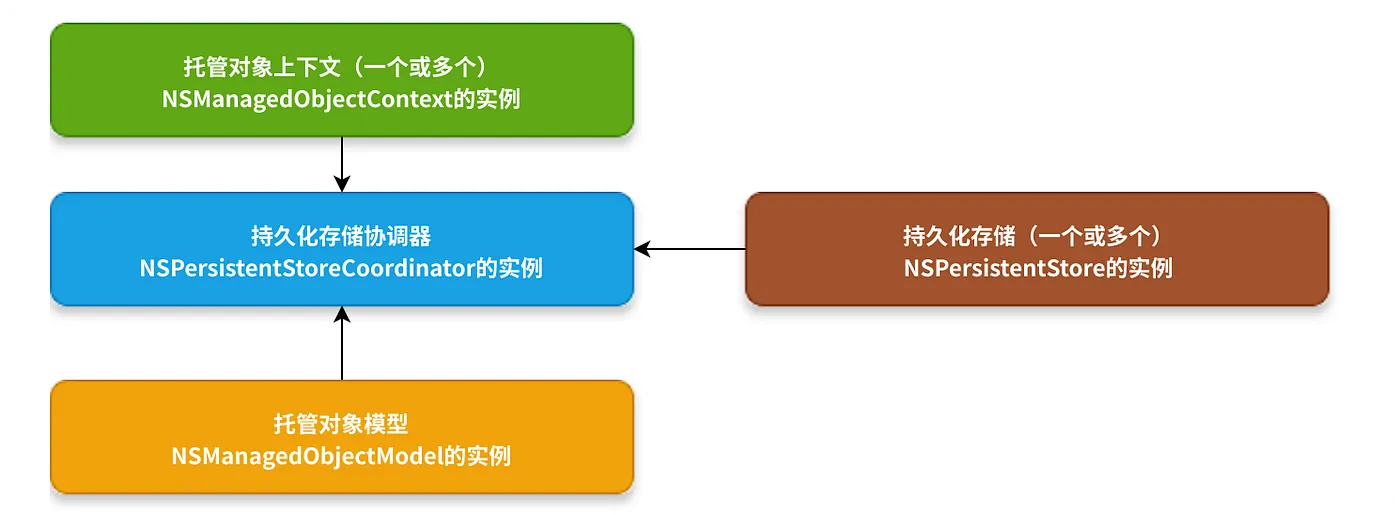
Among the many features of the coordinator, “row cache” is a very distinctive one. The so-called row cache refers to when Core Data retrieves data from SQLite, it first saves the data in a format close to the original storage format in the row cache (memory). And according to the needs of the context, the corresponding data is used to fill (instantiate) specific managed objects. The real significance of row cache is that when there are multiple managed contexts (NSMangedObjectContext) associated with the coordinator, for the content of the same record (NSManagedObjectID is consistent), there is no need to perform multiple IO operations, and it can be directly obtained from the row cache (if it can be hit).
From the perspective of today’s mobile development, the significance of row cache seems to be small, but considering that Core Data’s predecessor was mainly used to handle financial data business, in this scenario, row cache can bring considerable benefits.
Due to the existence of the row cache mechanism, when we retrieve certain data from the database through Core Data (such as images), there will be a copy in the row cache.
Lazy loading of managed objects
Lazy loading is an important feature of managed objects (NSManagedObject) in Core Data. In addition to being able to operate only in the managed context in which they were created, lazy loading is also an important feature of managed objects.
When a developer retrieves query results from the database by creating a request (NSFetchRequest), unless the returnsObjectsAsFaults property of the request is specifically set to false, the managed context does not return actual data for the managed properties (@NSManaged) of the managed object. Core Data only fills in the data for the managed object’s properties when accessing these managed properties (if there is data in the row cache, it is retrieved from the cache; if not, the data is moved from the database to the row cache and then retrieved from the cache).
Lazy loading is an important feature of Core Data. It ensures that data is only retrieved (instantiated) when there is a real need for it. This improves performance while minimizing memory usage.
In this example, the data for Item is only filled in when the view first appears in the visible area of the list.
After a managed object is no longer in a lazy state (Fault), it will only be converted back to a lazy state under certain specific conditions, such as by calling the refresh or refreshAllObjects methods.
Unless the relationshipKeyPathsForPrefetching property is set specifically, Core Data uses the default lazy loading rules for relationships related to an entity (even if returnsObjectsAsFaults is set to false), in addition to the entity’s own attributes.
Multiple Copies of Data
When image data is displayed through SwiftUI after passing through SQLite and Core Data, at least three copies are saved in memory:
- Row cache
- Managed object context (after filling managed objects)
- SwiftUI view displaying the image (in the value of ‘body’)
In the first round of optimization, we modified the value of ‘body’ for views leaving the visible area through display control (deleting one copy). If we can put the managed object back into a lazy state when the view leaves the visible area, we may be able to save some memory.
Because one coordinator can correspond to multiple contexts, if another managed object pointing to the same image is also filled in another context, another copy will be created.
Unsuccessful Optimization
Based on the code optimized in the first round, the following code was added:
.onDisappear {
    show = false
    // When the view leaves the visible area, try to make the Item and corresponding Picture objects return to the lazy state
    DispatchQueue.main.asyncAfter(deadline: .now() + 0.1) {
        viewContext.refresh(item, mergeChanges: false)
        if let picture = item.picture {
            viewContext.refresh(picture, mergeChanges: false)
        }
    }
}
After modifying and running the program, we were surprised to find that there was almost no change!
What is the reason???
By checking the managed objects in the code, it was found that although the managed objects have been converted to a lazy state, they did not actually save much memory. This is because we set the Allows External Storage option when defining the data property of Picture. This means that in the managed object context, the data property has only 50 bytes (file ID) even after being populated.
Currently, there is no information available on how Core Data handles external binary data in the row cache and context. However, through experimentation analysis, it is certain that these data are cached and will not be automatically cleared from memory after being loaded even when returned as lazy values.
Therefore, even if we return the managed object as a lazy value, we can only save a small amount of memory usage (which can be almost negligible in this case).
Limited but Promising Optimization
In order to have more precise control over the representation of image data in the context, I modified the setting of the data property by deselecting the “Allows External Storage” option.
To ensure smooth operation of the program, it is necessary to first delete the app from the simulator (or device) and then reinstall it.
Compared to the first round of optimization, there has been some improvement in memory usage after this optimization (less than 100 MB).

Although the effect of this round of optimization is average (and the memory usage still increases linearly after data is added), it at least indicates that there is an opportunity to find optimization angles from Core Data.
Ultimate optimization: private context + not holding managed objects
Idea
In the second round of optimization, although part of the memory usage problem was solved by converting managed objects into lazy values, the data in the row cache was still unable to be effectively cleared. Is it possible to optimize both the context and the space occupied by data in the row cache at the same time?
In order to reduce memory usage, Core Data adopts an active release strategy for unnecessary data space. If a managed object loses its strong reference, Core Data will quickly release the memory space it occupies in the context. If a record (data in the database) does not have a corresponding managed object in any context, its row cache space will also be quickly cleared.
That is to say, if we can create a managed object that points to the data only when the data appears in the lazy container visible range of the view, and delete the object (give up the reference) when the view leaves the visible area, we can complete this round of optimization through Core Data’s own memory release mechanism.
According to the above principle, we will try the following process:
- In the closure of onAppear, create a Picture object through a private context
- Convert the data property’s data to an Image and save it in a Source of truth in the view
- Display the Image in the view
- When the onAppear closure completes, the Picture object will be automatically released
- Clear the contents of the Source of truth in onDisapper (set to nil)
As expected, because the Picture managed object only exists in the onAppear block of the view, after the closure is executed, Core Data will automatically release the corresponding data in the context and row cache.
The code is as follows:
struct ItemCell: View {
    @ObservedObject var item: Item
    @State var image: Image?
    @Environment(\.managedObjectContext) var viewContext
    let imageSize: CGSize = .init(width: 120, height: 160)
    @State var show = true
    var body: some View {
        HStack {
            if show {
                Text(self.item.timestamp?.timeIntervalSince1970 ?? 0, format: .number)
                if let image = image {
                    image
                        .resizable()
                        .aspectRatio(contentMode: .fit)
                        .frame(width: self.imageSize.width, height: self.imageSize.height)
                } else {
                    Rectangle()
                        .frame(width: self.imageSize.width, height: self.imageSize.height)
                }
            }
        }
        .frame(minWidth: .zero, maxWidth: .infinity)
        .onAppear {
            show = true
            Task {
                if let objectID = item.picture?.objectID { // Getting the ObjectID won't trigger lazy loading
                    let imageData: Data? = await PersistenceController.shared.container.performBackgroundTask { context in
                        if let picture = try? context.existingObject(with: objectID) as? Picture, let data = picture.data {
                            return data
                        } else { return nil }
                    }
                    if let imageData {
                        image = Image(uiImage: UIImage(data: imageData)!)
                    }
                }
            }
        }
        .onDisappear {
            show = false
            image = nil
        }
    }
}
However, reality is far from ideal. After executing the above code, there is no significant improvement in memory usage. Where is the problem?
Releasing Inactive @State
The problem with the above code is that we use a variable declared as @State to temporarily store an Image. In an inactive container, @State does not actively release the memory occupied by the body, unlike the strategy for actively releasing memory capacity. Even if we set the variable to nil in onDisappear, SwiftUI does not release the space previously occupied by it.
The following code illustrates this:
struct MemeoryReleaseDemoByState: View {
    @State var data: Data?
    @State var memory: Float = 0
    var body: some View {
        VStack {
            Text("memory :\(memory)")
            Button("Generate Data") {
                data = Data(repeating: 0, count: 10000000)
                memory = reportMemory()
            }
            Button("Release Memory") {
                data = nil
                memory = reportMemory()
            }
        }
        .onAppear{
            memory = reportMemory() // reportMemory will report the current memory usage of the app. Please refer to the sample code in this article for implementation details
        }
    }
}
First click on “Generate Data”, then click on “Release Memory”, you will find that even though data is set to nil, the memory space occupied by the app does not decrease
In this case, we can create a Holder using a reference type to solve the problem of non-aggressive release.
struct MemeoryReleaseDemoByStateObject: View {
    @StateObject var holder = Holder()
    @State var memory: Float = 0
    var body: some View {
        VStack {
            Text("memory :\(memory)")
            Button("Generate Data") {
                holder.data = Data(repeating: 0, count: 10000000)
                memory = reportMemory()
            }
            Button("ReleaseMemory") {
                holder.data = nil
                memory = reportMemory()
            }
        }
        .onAppear{
            memory = reportMemory()
        }
    }

    class Holder:ObservableObject {
        @Published var data:Data?
    }
}
SwiftUI only holds a reference to the instance corresponding to @StateObject, and the release of property data in the instance still follows the standard logic of the Swift language. Therefore, through Holder, we can release unnecessary memory according to our own needs.
struct ItemCell: View {
    @ObservedObject var item: Item
    @StateObject var imageHolder = ImageHolder()
    @Environment(\.managedObjectContext) var viewContext
    let imageSize: CGSize = .init(width: 120, height: 160)
    @State var show = true
    var body: some View {
        HStack {
            if show {
                Text(self.item.timestamp?.timeIntervalSince1970 ?? 0, format: .number)
                if let image = imageHolder.image {
                    image
                        .resizable()
                        .aspectRatio(contentMode: .fit)
                        .frame(width: self.imageSize.width, height: self.imageSize.height)
                } else {
                    Rectangle()
                        .frame(width: self.imageSize.width, height: self.imageSize.height)
                }
            }
        }
        .frame(minWidth: .zero, maxWidth: .infinity)
        .onAppear {
            show = true
            Task {
                if let objectID = item.picture?.objectID {
                    let imageData: Data? = await PersistenceController.shared.container.performBackgroundTask { context in
                        if let picture = try? context.existingObject(with: objectID) as? Picture, let data = picture.data {
                            return data
                        } else { return nil }
                    }
                    if let imageData {
                        imageHolder.image = Image(uiImage: UIImage(data: imageData)!)
                    }
                }
            }
        }
        .onDisappear {
            show = false
            self.imageHolder.image = nil
        }
    }
}

class ImageHolder: ObservableObject {
    @Published var image: Image?
}
In the final code, we have effectively controlled the three copies of image data in memory. At the same time (ideally), only the image data that appears in the visible area will be saved in memory.

It is possible to increase the level of detection. Even when generating 400 records, the memory usage is still kept under control in a fairly ideal state (the following picture shows the memory usage when 400 data are scrolled to the bottom).

At this point, we have finally completed the optimization of this code segment, without having to worry about the possibility of it crashing due to excessive memory consumption.
Summary
The lazy container in SwiftUI is very convenient to use, and it is also very convenient to work with Core Data through @FetchRequest. This to some extent leads to the mentality of developers underestimating the complexity of SwiftUI + Core Data, thinking that they will handle everything for us. However, in some cases, we still need to deeply understand both and optimize the code to achieve the desired results.